Tables
Table 26. Plant remains from 1985 flotation samples (weights in grams).
Table 27. Plant food remains from 1985 flotation samples (weights in grams).
Table 28. Percentage of plant food remains from 1985 flotation samples.
Table 29. Seed/fruit counts for burials, features, and structure from 1985 flotation samples.
Table 30. Plant ubiquity at the Fredricks site as percentage of features (1985 samples).
Table 31. Percentages of nutshell from 1983, 1984, and 1985 flotation samples.
Table 32. Percentages of plant food remains from 1983, 1984, and 1985 flotation samples.
Table 33. Seed/fruit counts and proportions from 1985 flotation samples.
Table 34. Seed/fruit counts and proportions from 1983, 1984, and 1985 flotation samples.
Table 35. Plant remains from Features 35 and 37 (1985 flotation samples; weights in grams).
Table 36. Plant remains from Feature 36 (1985 flotation sample; weights in grams).
Table 37. Plant remains from Feature 30 (1985 flotation sample).
Figures: General
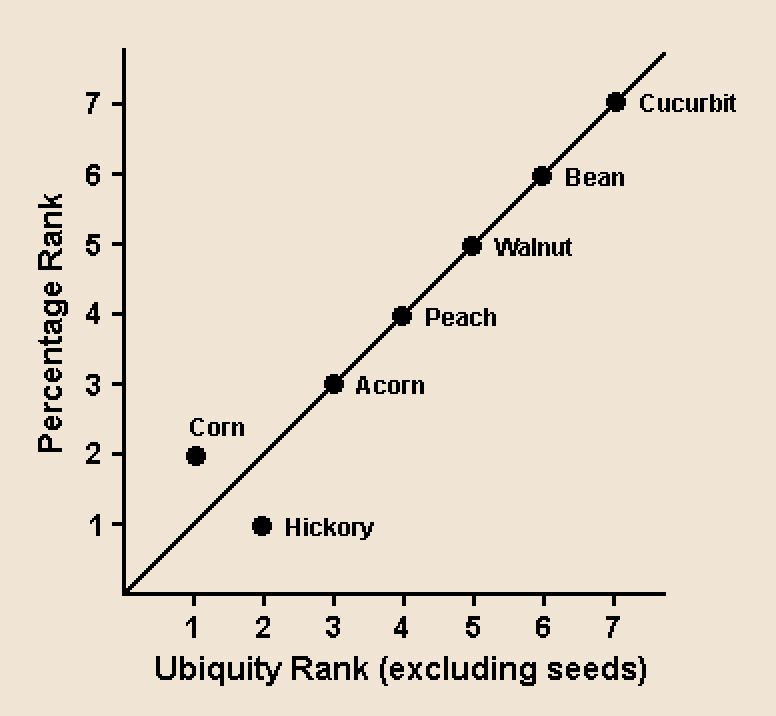
Figure 471. Comparison of ubiquity and percentage rankings for plant remains from the Fredricks site (by weight).